Advanced Example eRosita
Responsible Geant4 Collaborator: Francesco Longo (INFN-Ts, Trieste, Italy)
Developers: Dieter Schlosser, Georg Weidenspointner and Maria Grazia Pia
Short description
eROSITA is an astronomical X-ray full-sky survey mission on-board the Spectrum-X-Gamma space mission. It was launched on 13 July 2019.
The main scientific goals of eROSITA are a systematic detection and analysis of all obscured accreting Black Holes in nearby galaxies and of ten thousand galaxy clusters. Furthermore the nature of dark energy and dark matter will be investigated.
Simulation for the optimization of eROSITA shielding
The Geant4 PIXE software has been successfully applied to the optimization of the graded shielding of the eROSITA mission.
The purpose of the passive shielding is two-fold:
- the passive shielding prevents abundant low-energy cosmic-ray particles from reaching the detectors and thus from causing radiation damage;
- the passive graded Z shielding serves to reduce instrumental background noise to a minimum. This background noise consists of both fluorescence lines and continuum background due to Bremsstrahlung photons and rays from cosmic-ray interactions.
The event timing accuracy of current imaging Si detectors for X-ray astronomy (photon energy range 0.1–15 keV) is limited by the signal integration time of these devices. For such detectors, an active anti-coincidence system cannot be used for background reduction because discarding complete readout frames correlated with an anti-coincidence signal would result in unacceptable dead time.
Detector triggers due to primary cosmic-ray particles can be discriminated in imaging detectors due to their high energy deposit and their pixel image pattern. However, interactions of primary cosmic-ray particles in the detector and surrounding passive material give rise to secondary X-rays and charged particles. These may in turn lead to detector triggers within the accepted energy range.
Such triggers contribute to the instrumental background noise, because they cannot be distinguished from valid events due to cosmic X-ray photons that were focused by the telescope mirror system onto the detector.
The production of secondary photons and particles by the ubiquitous cosmic radiation is inevitable, but graded Z shielding permits the shifting of the energy of secondaries from atomic deexcitation to low values.
In a graded Z shield cosmic-ray induced fluorescence X rays produced in an outer, higher Z layer of the shield are absorbed in an inner, lower Z layer. Subsequent atomic deexcitation, for instance following photoionization, in this inner layer gives rise to fluorescence photons and Auger electrons with energies that are lower than the energies of the deexcitation particles from the outer layer; in addition, there will be relatively more deexcitation electrons than X-rays. If the effective charge number Z of the innermost shield layer is sufficiently low, ionization results in the generation of mainly Auger electrons with energies below 1 keV, which can easily be stopped in a thin passive layer on top of the detectors. Ionization can also create rare fluorescence X rays of similarly low energy.
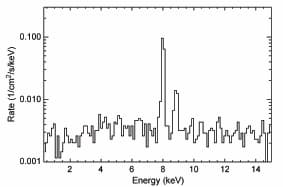
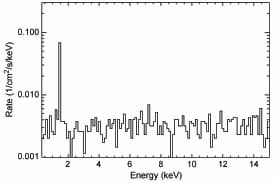
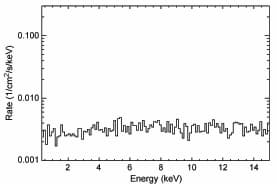
A first set of graded Z shield designs was studied by Monte Carlo simulation, using the prototype PIXE software together with Geant4 versions 9.1-patch 01. The detector chip was placed inside a box-shaped shield Three shielding configurations were studied:
- a single 3 cm thick layer of pure Cu,
- the graded Z shield had a 1 mm thick Al layer inside the Cu layer,
- a 1 mm thick B4C layer was added inside the Al layer.
A model for the detector response, taking into account Fano statistics (and hence the energy resolution) and detector noise, was then applied to obtain a simulated data sets. These simulated data were further processed with algorithms that have been developed to eliminate charged particle tracks or invalid pixel image patterns and to select and reconstruct events that are most likely due to single photons; these procedures are identical to those applied to actual satellite data.
The resulting spectra, which represent the average background in a detector pixel, are shown below in Figure 2a, 2b and 2c.
Overview of the eRosita example
A simplified version of the eROSITA simulation is available as the Geant4 eRosita advanced example.
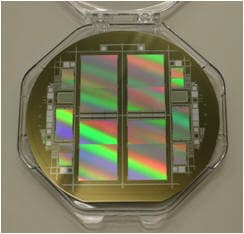
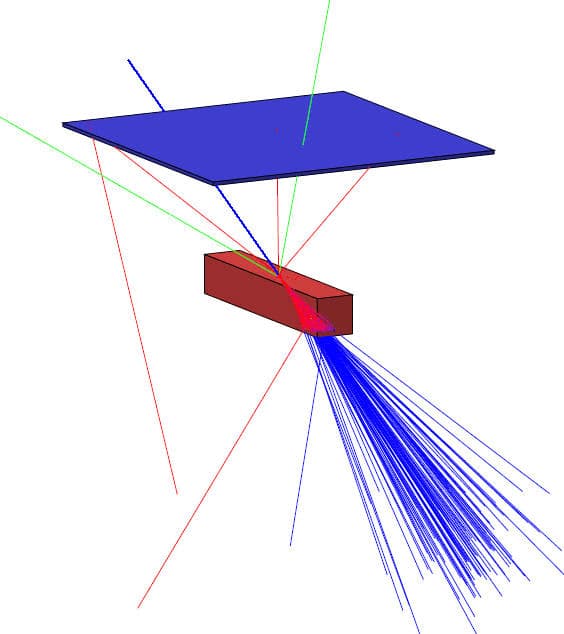
The set-up considered in this example consists of a Cu block that is irradiated with protons (see Figure 3). Impact ionization of Cu atoms generates vacancies in atomic shells. These are then filled by atomic de-excitation, resulting in the emission of fluorescence photons and Auger electrons - the PIXE (particle induced X-ray emission) process. Fluorescence photons are then detected with a Si CCD positioned next to the Cu block.
The simulated set-up is defined in eRositaDetectorConstruction. The Cu block is located at position x = y = z = 0 cm. Its dimensions in x, y, and z are 0.5 cm * 0.5 cm * 3 cm. The CCD, represented by a slab of Si, is positioned at x = z = 0 cm and y = 2 cm. The CCD dimensions in x, y and z are 4 cm * 450 mu_m * 4 cm.
The vertex and initial momenta of the protons are defined in eRositaPrimaryGeneratorAction. The vertex is at x = 0 cm, y = 2.25 cm, and z = 4 cm. The initial direction of the protons is given by the vector (0.0, -0.5, -1.0). The initial kinetic energy of the protons is 150 MeV.
The physics processes relevant to this simulation are defined in eRositaPhysicsList.
The output of the example is an ASCII file named TrackerPhotonEnergy.out. It contains the energy, in MeV, of every photon that finds its way to the tracker (or which is created as a secondary inside the tracker). The entries 0.00798467, 0.00800571, and 0.00886534 correspond to Cu fluorescence lines Kalpha2, Kalpha1, and Kbeta1, respectively. Other photons originate e.g. from Bremsstrahlung of delta rays in Cu.
A histogram of the energies in TrackerPhotonEnergy.out (see Figure 4) clearly shows the PIXE photons from Cu on top of a continuous distribution, if a sufficiently large number of events is generated to appreciate the physics details of the detected photon spectrum.
References
- M. G. Pia, G. Weidenspointner, M. Augelli, L. Quintieri, P. Saracco, M. Sudhakar, A. Zoglauer, PIXE simulation with Geant4, IEEE Trans. Nucl. Sci., vol. 56, no. 6, pp. 3614-3649, Dec. 2009.
Last updated: 01/12/2023 by S. Guatelli