Advanced Example microbeam
Responsible Geant4 Collaborator: Sebastien Incerti, LP2i, IN2P3, Bordeaux, France
Short description
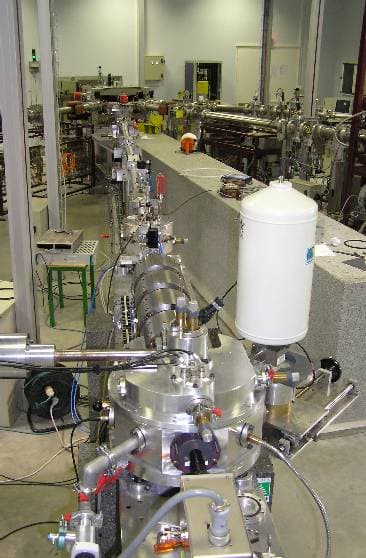
The microbeam example simulates the microbeam cellular irradiation beam line installed on the AIFIRA electrostatic accelerator facility located at LP2i, Bordeaux, France. This setup is mainly used to investigate the effects of low dose irradiation on living cells. The microbeam line allows irradiation of individual biological living cells in culture medium in single ion mode, with exact control of the delivered dose to a particular cell among the cell population. This Geant4 example simulates the microbeam line in a configuration of irradiation with 3 MeV incident alpha particles and allows the calculation of the dose deposited by the incident particles in the cell cytoplasm and in the cell nucleus, which are inaccessible by experimental measurements. For the first time in Monte Carlo microdosimetry, the simulation includes a realistic cell phantom obtained from confocal microscopy and from ion beam analysis techniques.
For more information on this irradiation facility, please visit: https://www.lp2ib.in2p3.fr/
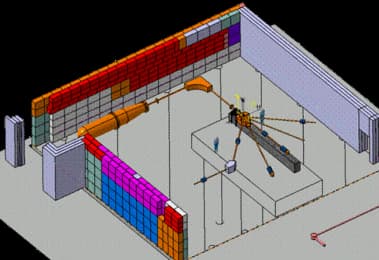
Simulated experimental setup
The beam is emitted just before the 100 switching magnet taking into account experimental beam parameters measurements; the main elements simulated are:
- A switching dipole magnet with fringing field, to deflect by 10° the 3 MeV alpha beam generated by the electrostatic accelerator into the microbeam line, oriented at 10 degrees from the main beam direction;
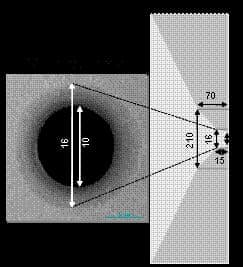
- A circular object collimator, defining the incident beam size at the microbeam line entrance; the collimator has been simulated from realistic electron microscopy images;
- A quadrupole based magnetic symmetric focusing system allowing equal transverse demagnification of 10. Fringe fields are calculated from Enge’s model;
- A dedicated cellular irradiation chamber setup, taking into account all the elements encountered by the incident beam (diaphragm, gas detector, isobutane, beam extraction window, air, culture foil, culture medium, cell dish…);
- A set of horizontal and vertical electrostatic deflecting plates which can be turned on or off to deflect the beam on target;
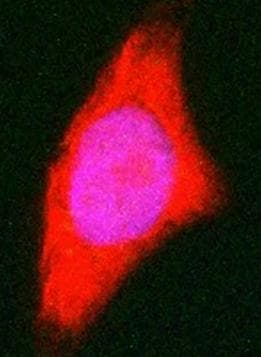
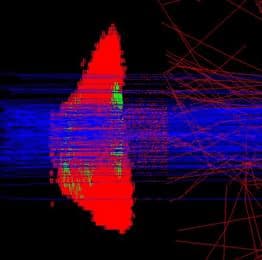
- A realistic human keratinocyte voxellized cellular phantom observed from confocal microscopy and taking into account realistic nucleus and cytoplasm chemical compositions. The phantom uses the G4PVParameterised class.
Physics
Low energy electromagnetic processes (for alphas, electrons, photons) and hadronic elastic and inelastic scattering for alphas are activated by default. In the proposed Physics list (which uses Physics builders), standard electromagnetic processes replace low energy electromagentic processes above 1 GeV. This shows to users how to implement a combined Physics list between low energy electromagnetic models and standard electromagentic models.
How to install and run the example
Please, look at the README file provided with the example.
Simulation results
The output consists in a ROOT file (http://root.cern.ch) created directly in the microbeam directory. It contains:
- the total deposited dose in the cell nucleus and in the cell cytoplasm for each incident alpha particle;
- the average dose deposited per voxel per incident alpha particle;
- the final stopping (x,y,z) position of the incident alpha particle within the irradiated medium (cell or culture medium);
- the actual stopping power dE/dx of the incident alpha particle just before penetrating into the targeted cell;
- the beam transverse position distribution (X and Y) just before penetrating into the targeted cell;
The ROOT macro plot.C gives the graphical output depicted in Figure 6, obtained for 20000 incident alpha particles.
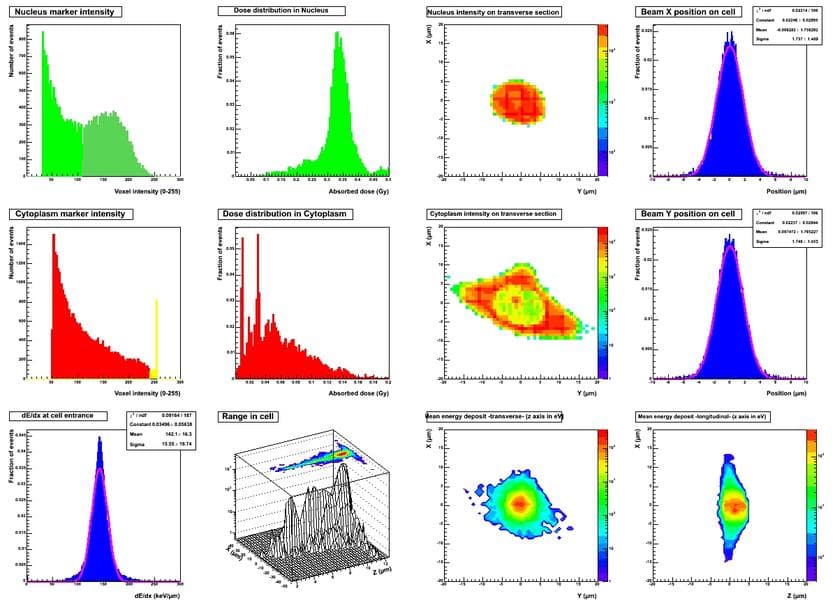
TOP row
- left plot : nucleus voxel intensity (0-255) distribution, two density zones have been isolated in the simulation;
- middle left plot : alpha dose deposit in nucleus;
- middle right plot : nucleus voxel intensity projected on cell transverse section;
- right plot : beam transverse (X) position distribution on target. The sigma of the Gaussian fit is compatible with the measured experimental value.
MIDDLE row
- left plot : cytoplasm voxel intensity (0-255) distribution, two density zones have been isolated (one for pure cytoplasm in red, the other for nucleoli in yellow)
- middle left plot : alpha dose deposit in cytoplasm
- middle right plot : cytoplasm voxel intensity projected on cell transverse section
- right plot : beam transverse (Y) position distribution on target. The sigma of the Gaussian fit is compatible with the measured experimental value.
BOTTOM row
- left plot : beam stopping power dE/dx distribution at cell entrance
- middle left plot : 3D distribution of alpha particle range in cell or medium
- middle right plot : projected mean energy deposit per voxel (transverse, z axis is in eV)
- right plot : projected mean energy deposit per voxel (longitudinal, z axis is in eV).
The simulation predicts that 95% of the incident alpha particles detected by the gas detector are located within a circle of 10 µm in diameter on the target, in good agreement with experimental measurements performed on the CENBG setup.
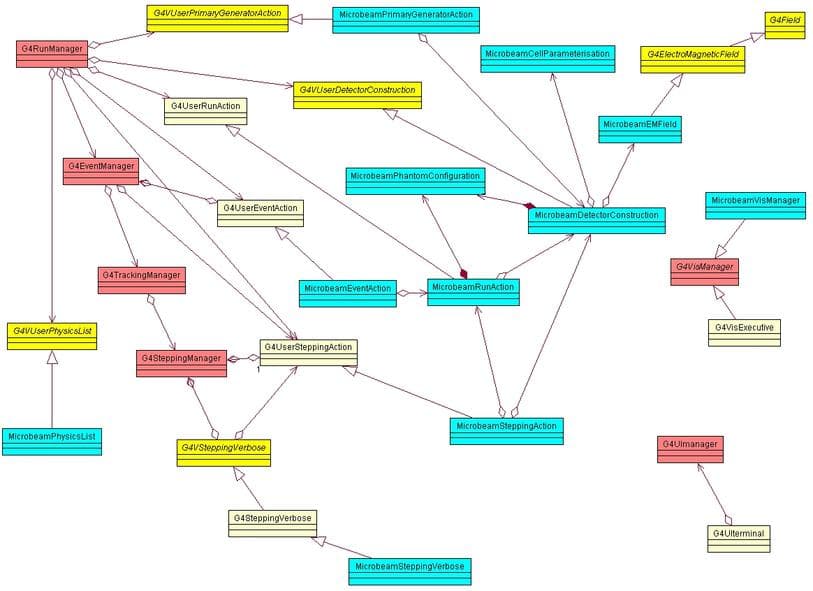
Code design
The Microbeam code design obtained from the Rational Rose software is shown in Figure 7. Manager classes are filled with red and Microbeam classes are filled with sky blue.
Suggested papers
- Monte Carlo dosimetry for targeted irradiation of individual cells using a microbeam facility, S. Incerti, H. Seznec, M. Simon, Ph. Barberet, C. Habchi, Ph. Moretto, Rad. Prot. Dos. 133, 1 (2009) 2-11 link
- Monte Carlo simulation of the CENBG microbeam and nanobeam lines with the Geant4 toolkit, S. Incerti, Q. Zhang, F. Andersson, Ph. Moretto, G. W. Grime, M. J. Merchant, D. T. Nguyen, C. Habchi, T. Pouthier, H. Seznec, Nucl. Instrum. and Meth. B 260 (2007) 20-27 link
- Cellular geometry modeling for Monte Carlo microdosimetry, T. Pouthier, H. Seznec, S. Incerti, O. Boissonnade and Ph. Moretto, Rad. Res. Vol. 166 (4) (2006) 652-689 link
- A comparison of cellular irradiation techniques with alpha particles using the Geant4 Monte Carlo simulation toolkit, S. Incerti, N. Gault, C. Habchi, J.L. Lefaix, Ph. Moretto, J.L. Poncy, T. Pouthier and H. Seznec, Rad. Prot. Dos. (2006) 1-3 link
- Geant4 simulation of the new CENBG micro and nanoprobes facility, S. Incerti, C. Habchi, Ph. Moretto, J. Olivier and H. Seznec, Nucl. Instrum. and Meth. B 249 (2006) 738-742 link
- Simulation of cellular irradiation with the CENBG microbeam line using Geant4, S. Incerti, Ph. Barberet, R. Villeneuve, P. Aguer, E. Gontier, C. Michelet-Habchi, Ph. Moretto, D.T. Nguyen, T. Pouthier and R.W. Smith, IEEE Trans. Nucl. Sci. 51 (4) (2004) 1395-1401 link
- Simulation of ion propagation in the microbeam line of CENBG using Geant4, S. Incerti, Ph. Barberet, B. Courtois, C. Michelet-Habchi and Ph. Moretto, Nucl. Instrum. and Meth. B 210 (2003) 92-97 link
Last updated: 18/02/2022 by S. Guatelli